Roeder Financial .com - Where Vision Meets Reality

More Information:
Roeder Financial
4532 Westview Drive, Suite 100
La Mesa, CA 91941-6433
(619) 300-8500
California Pension Systems: Ranking their Funding Assumptions
(Has the actuarial process failed?)
Rick Roeder, FSA April 2020
This is the eleventh periodic survey (click here to see survey results in a new window) which ranks the funding assumptions used by California’s public pension systems from “most conservative” to “most optimistic.” In the related spreadsheet, the “most conservative” system is ranked as #1 and “most optimistic” system is ranked as #37.
There is no absolute “right” or “wrong” in setting assumptions. There can be a number of valid reasons that an assumption package for Entity A differs from Entity B. Entity A might have a larger equity allocation than Entity B. Entity C might wish to have more conservative assumptions to be able to fund potential ad hoc benefits. The nation’s largest state plan, CalPERS, may be able to have certain size-related investment efficiencies unavailable to smaller sponsors.
A seeming contradiction has existed during the decade in which these surveys have been completed. There has not been even one instance of ANY entity increasing their assumed rate of investment return during the past 11 years! — despite a decade-long bull market. This raises two questions: Were assumed investment returns too high a decade ago? Are current assumed returns fully reflective of the timing and duration of the next bear market? We offer some observations at the end of this analysis.
Nor does traditional actuarial funding address a paradox: other factors equal, more contribution volatility exists for better funded plans than those with lower funded ratios. Actual investment returns can diverge wildly from assumed returns during a market cycle. Higher asset levels mean that the dollar magnitude of potential actuarial gains or losses is also greater.. After the “learning experience” brought about by the 2001-2009 bear market, some Systems established policies which would keep a greater reserve during the “good times” when and if funded ratios again exceed 100%. Other entities, such as CalPERS, have decided that traditional smoothing methods did not achieve desired stability and have used a blunt approach which directly smoothes contribution changes over a period of years — on top of other smoothing methods. Segments of the actuarial community believe that current professional standards, if in place during the 1990’s, might have precluded today’s environment. Perhaps so. Such changes will certainly help but the “political risk” of benefit decisions during the “good” times will remain.
Even though active employees benefit in their retirement years by having well funded systems, making assumptions more conservative can have a “cost” for actives. Lower assumed investment assumptions often directly or indirectly translate into higher employee contributions. In recessions, it is not unusual for plan sponsors to tell Retirement Boards that a lack of pension contribution relief will result in potential layoffs.
Defining some of the characteristics of “most conservative” versus “most optimistic” is useful.
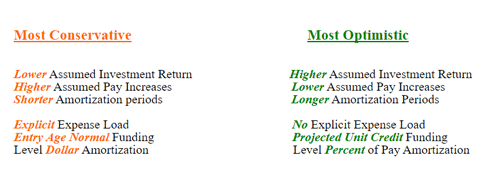
Using comparative funded ratios, to determine how well funded a plan is, can be misleading:
- Actuarial assumptions will often not be comparable.
- A relatively high funded ratio could be largely attributable to Pension Obligation Bonds (POB).
In looking at the financial viability of a plan, it is essential to look at more than just than the computed actuarial rates if there is also POB debt service.
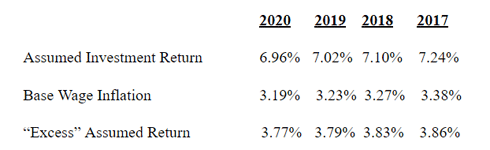
The most significant development in the 2020 survey, for the eighth straight year, continues to be the lowering of both assumed investment returns and inflation assumptions. Number of entities lowering assumed investment return:

78% now use an assumed investment return in the 7%-7.25% range. In the past decade the “standard” has decreased by 1%. In our initial 2009 survey, 60% of the entities used an investment assumption of at least 8%. In this year’s survey, only the San Francisco system used an assumed return higher than 7.25%.
Several points should be noted on the amortization of unfunded liabilities. “Open” or “rolling” methods will use the same number of years in a future valuation as is been used in the current valuation. “Layered” means that there is a new amortization base established each year which is funded on a “closed” or “declining” basis. If one believes that a best practice is for an individual’s benefit to be fully funded at their anticipated retirement date, sound practice is to have the amortization period be closely correlated with the average future working lifetime of the active member group (typically between 11 and 15 years). 30-year amortization passes a significant part of the cost, attributed to current participants, to a future generation of taxpayers. Some entities in the survey still have amortization periods of 20+ years for all or significant elements of their unfunded liability — not a best practice. All amortization approaches noted in this survey should be assumed to be level percent of payroll unless otherwise indicated. Level-percent-of-payroll amortization will produce a lower current year contribution than level dollar amortization over the same period.
To the extent actuarial losses occur in the future, such losses will become more problematic. This is due to the changing demographics of maturing systems. For many systems, the number of inactive members has approached or exceeded the number of active membership in recent years. Spreading losses on a relatively small payroll base means more volatility in contribution rates, other factors equal.
SOME OBSERVATIONS ON THE ACTUARIAL PROCESS
Nobody knows the impact COVID-19 will have on the equity markets over the next 4-6 fiscal quarters. However, it is safe to say that healthy returns for the fiscal year ending June 30, 2020 seem pretty unlikely as of mid-April. Yet one can never say for sure! I remember the utter collapse of the market early in calendar year 1987. If you had said on February 15, 1987 that the equity markets for calendar year 1987 would show a nice gain, the immediate presumption would have been that you just drained a dozen Coronas.
However, I am more bothered about what has happened during the past six years than what might happen the next two or three. If there was ever a scenario where actuarial rates should be going down, the 2014-2019 period would have seemed to be ideal for such a scenario. Most entities in our survey were gradually impacted by lower benefit formulas mandated by PEPRA (for post-January 1, 2013 hires). The equity market was continuing its decade-long gallop toward Dow 30,000. Despite those considerable tailwinds, one would have to look long and hard for entities with lower rates in their 2019 valuations when compared to their first post-PEPRA valuation. Strange! Twenty years ago, if you were told that many entities would have employer contribution rates at 30+ % of payroll and upward, you would be in some state of disbelief. And if you were then told that Fresno County’s rate would be above 60% and the City of San Diego system (mostly closed) would be at 80%, you would have been absolutely sure that you were being victimized by an April Fool’s joke.
One observation from our most recent review is that many entities reported trailing 5-year and 10-year yields that I would deem disappointing. Did active management of equity portfolios often prove to be a disappointment? In general, one might conclude so.
A clear mission of the actuarial process is to “level out” plan costs from generation to generation. This has not happened in almost 20 years and COVID-19’s specter might mean further increases despite the increasing downward impact of PEPRA with each passing year.
Did the actuaries do their due diligence in the assumed investment returns that were employed? On average, the assumed investment returns have gone down by 1% per annum since our initial 2009 survey. Perhaps decreases needed to be greater. I am willing to admit that I was likely wrong during my actuarial career in being too optimistic in setting assumptions. However, even if I was NOT so optimistic, would the Retirement Board have allowed me to use a return lower than the herd? Increasing contribution rates always seem to have marked impact on perpetually tight budgets. If an actuary was convinced that 5.5% was the best long-term assumption, would that actuary be retained by a Retirement Board? Certainly, one could easily find another actuary willing to sign off on a much higher assumed investment return, especially when told by their investment advisors that THEIR active management will earn the System premium returns. All of which argues that a greater degree of independence in the selection of a System’s actuary is a solid idea.
Actuaries have used many approaches to “moderate” any changes in contribution rates. Remember the Great Recession? A number of surveyed entities diverged from their usual policy and gave special dispensation to the plan sponsor. Is there any element of actuarial theory to support such divergence? No. When the equity market was in an unprecedented bull market from 1983-2000, was there recognition of such a “special” unprecedented market? No. Instead, the massive equity gains became the impetus for increasing benefits to unprecedented levels. Sure, after the horses had bolted the barn, some entities decided to have more of a buffer during great markets. But the simple reality is that benefit levels are quite likely to never return to their former levels.
The actuarial process was designed to have relatively level contribution rates so that different generations of taxpayers are treated in a reasonably equitable manner.
This has not happened during the past 20 years. Likely, some good lessons to be learned.
The source for survey data has largely been from the most recent actuarial valuation report on system web sites. Plan administrators and selected actuaries were sent a draft report to give them the opportunity to make any corrections and updates. The final version will be on the Ramble at roederfinancial.com. Thanks to the many who helped update the survey. If you have any questions, Rick Roeder can be reached at (619) 300 — 8500 or via rick@roederfinancial.com.
Guest authors are
welcome to submit articles and their thoughts to the ROEDER RAMBLE
for potential viewing on this site.
Copyright © 2009 & beyond by Roeder Financial, all rights reserved.
Site created by
Open Sky Web Design using a template design by Nadia